Data Center Assistance Group, LLC

GRC Review with Problem and Business Continuity Management
Enterprise IT Strategy, Governance & Resilience Services
Enterprise Resilience and Optimization
Site Reliability Engineering Overview and Implementation Plan
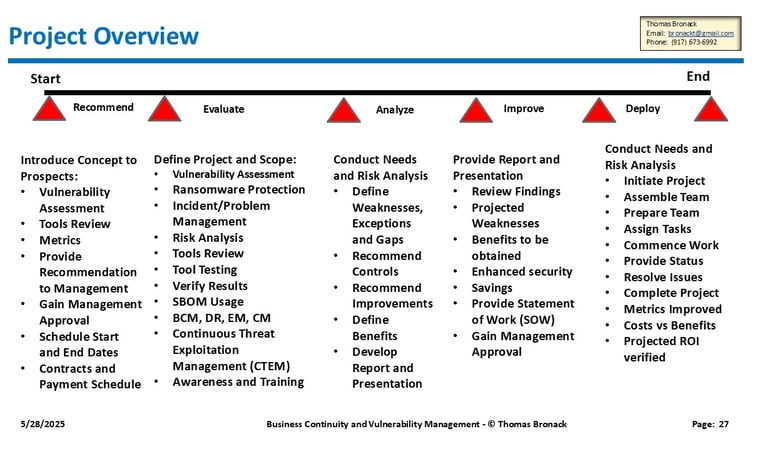
DCAG Executive Overview of 10 Step DR Project
DCAG DR Capabilities Overview
PQC Readiness and Migration Planning
Enterprise Resilience Frameworks
CSF 2.0 and Service Continuity Executive Overview
Risk Assessment and Audit Management
Vulnerability Management
Compliance Certification Programs
CSF 2.0 Cyber Security Readiness
DevSecOps Planning and Implementation
Incident / Problem Management Services
HIPPA and Healthcare Industry Guidelines
Future-Proof your Enterprise through DCAG Supplied Services from PQC through Business Continuity Management
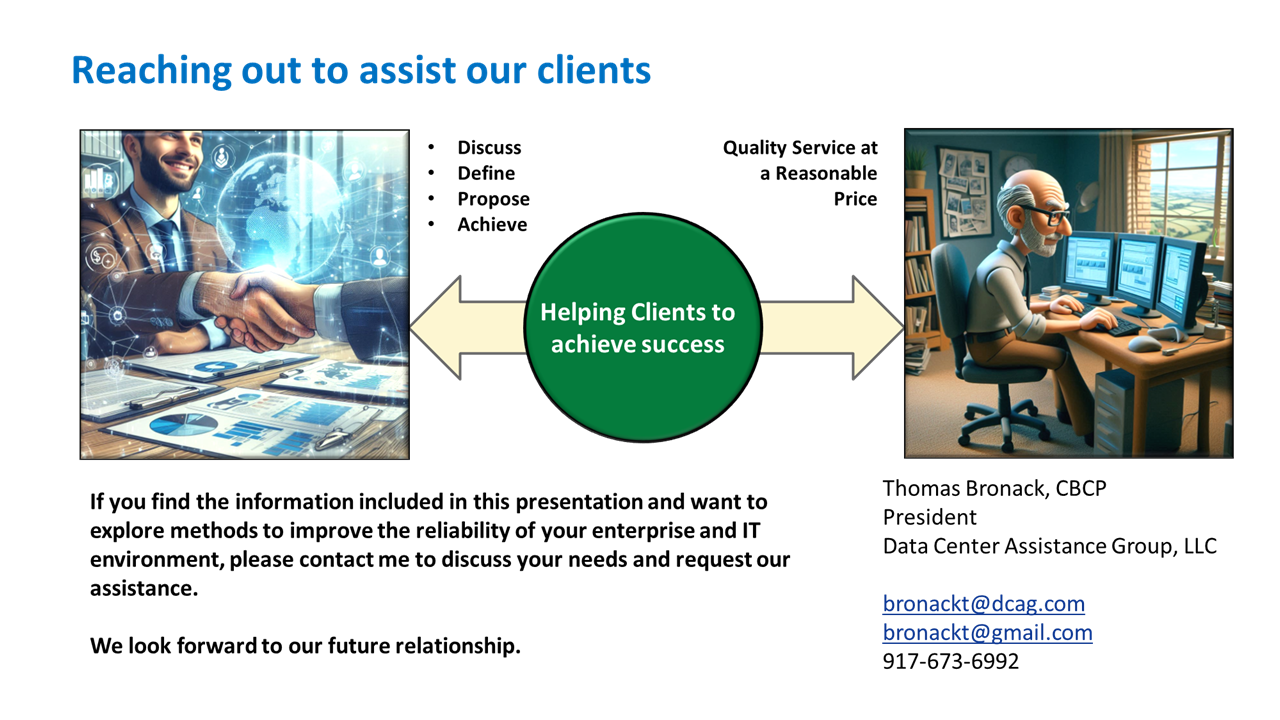
Your Partner in IT Resilience
At Data Center Assistance Group, LLC, we specialize in IT consulting, focusing on enterprise resilience, compliance certification, risk management, and business continuity to optimize your IT environment.
Empowering Secure IT Solutions
Expertise in Compliance Assurance
Our mission is to deliver secure, compliant, and optimized IT solutions that enhance your business's productivity and resilience in an ever-evolving technological landscape.
Comprehensive IT Services
We specialize in enterprise resilience, compliance certification, risk management, and business continuity for optimized IT environments.
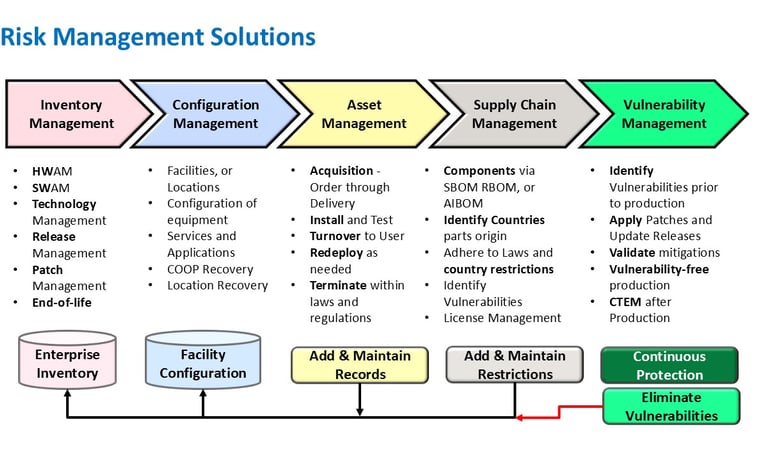
Risk Management Solutions
Our risk management services identify vulnerabilities and ensure your IT infrastructure is secure and compliant.
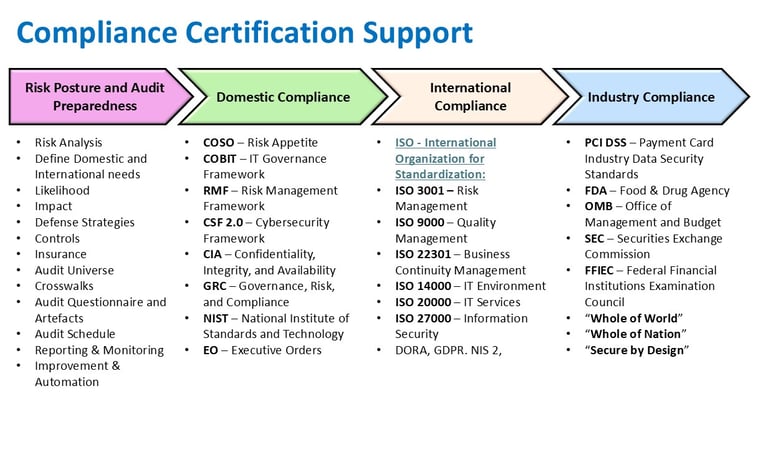
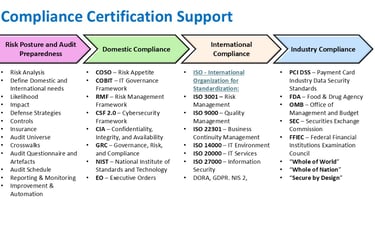
Compliance Certification Support
We assist businesses in achieving corporate compliance certifications to enhance operational integrity and trustworthiness.
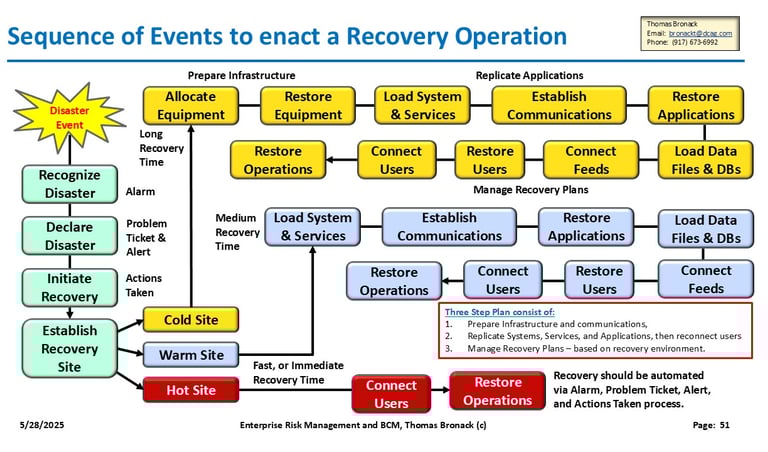
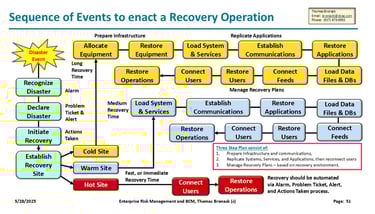
Our services ensure business continuity, safeguarding operations against disruptions and enhancing overall resilience.
Business Continuity Planning
Our Projects
Explore our expertise in IT consulting and enterprise resilience.
Risk Management
Comprehensive strategies for identifying and mitigating risks.

Compliance Solutions
Ensuring your business meets all regulatory requirements effectively.
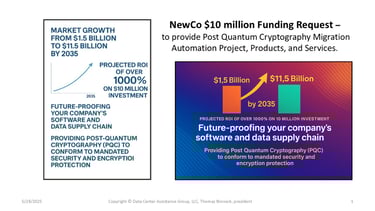
Post Quantum Computing (PQC)
Maintaining cryptography protection after Quantum computers
Builds, Consolidations, and Migrations
Growing,condensing, and optimizing your environment
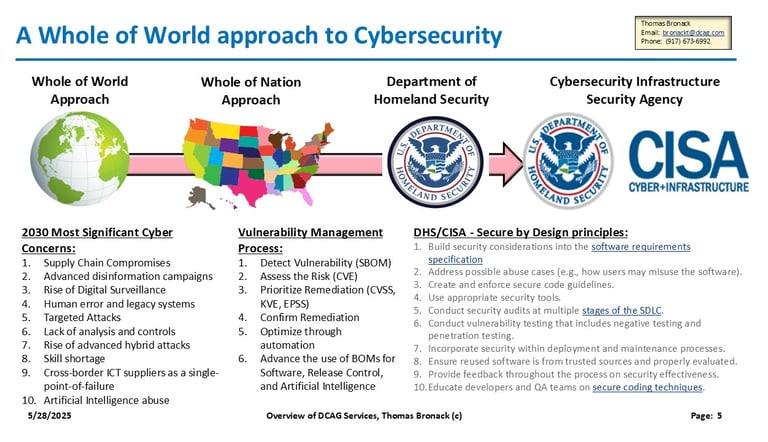
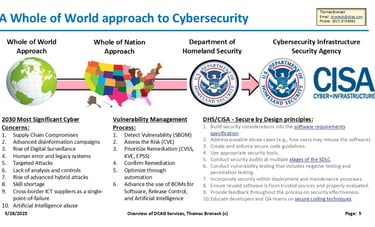
Whole of Nation Approach
Utilizing "Secure by Design" CISA Guidelines
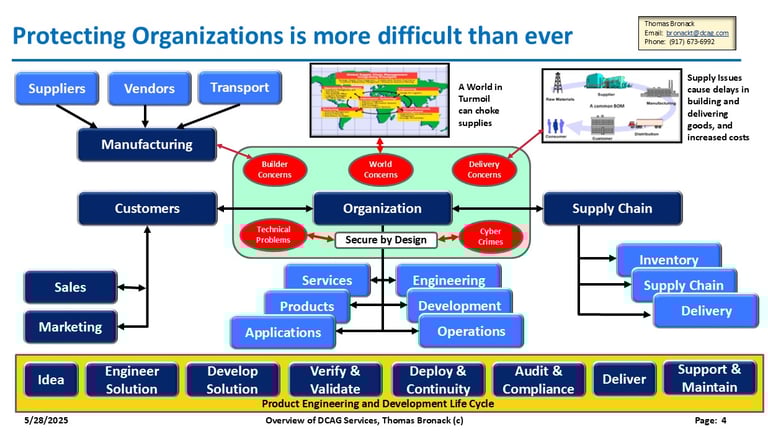
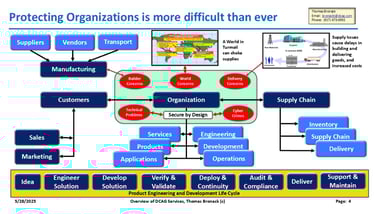
Protecting the Enterprise World-Wide
Third Party Risk-Assessment (TPRM) and Supply Chain Management
Cyber crimes and technical threats cost Trillions of dollars and are at approx. ten percent of world-wide GDP. World leaders came together to formulate a plan of attack, which gave guidance to Nations. The US assigned the issue to DHS, who mandated CISA to address the issues. CISA issued a guideline called "Secure by Design" and asked companies to pledge to agree to it its guidelines.

Data Center Assistance Group transformed our IT resilience and compliance processes remarkably. Highly recommended for businesses!
Tech Innovator

Their expertise in risk management and post-quantum cryptography has significantly enhanced our security posture. Truly invaluable!
Cyber Secure
